
The Cost of Being Wrong
Comparing an agent with a human process honestly: three baselines, one expected-cost equation, and the questions the arithmetic cannot answer.
Draft. The citations below are being validated against the publisher pages and the numbers in the examples are illustrative, not measured results.

Key takeaways
- Raw error rates are not comparable until both sides are measured after the same controls, on the same cases, over the same window.
- Expected cost, not accuracy, is the decision. Six terms, every one of them a number you can go and measure.
- The loss per error sits between the cost of correction and the cost of going unnoticed, and detection is the whole difference between them.
- Legal, regulatory, privacy, safety and contractual limits override the arithmetic. A cheaper process that is not permitted is not cheaper.
Why raw error rates do not compare
Every agent evaluation arrives with a headline number: two percent error rate, ninety-seven percent accuracy, zero critical incidents. That number is almost never what decides the question. It is the least useful figure in the comparison, because the two sides of the comparison are rarely measured the same way.
A human process is measured after the controls that have been running for years: peer review, escalation, a second signature on anything unusual. An agent is measured on the output it emits, before anyone has looked at it. Those are different measurements of different stages. Set them side by side and the comparison is not measuring the agent against the human process. It is measuring the human process of quality assurance against the raw output of a model.
The same trap opens from the other side. A number measured after a review step, compared against a baseline measured before one, is not wrong. Both figures are accurate descriptions of their own stage, and the gap between them is the cost of the review, which is precisely the cost the analysis is trying to measure.
There is a third trap in the same family, and it lives in the denominator. Cost per transaction can fall while the share of transactions that end in an accepted, correct outcome does not rise. The denominator that survives scrutiny is the cost per independently accepted outcome, which is harder to come by and worth the trouble.
Three baselines worth comparing
There are three configurations worth putting on the same page, and only three. Human only: the process as it runs today, controls included. AI only: the agent emits and no human looks. Selectively reviewed AI: the agent emits, and a human reviews a stated fraction of the work under a stated policy.
They are named separately because the economics differ in kind, not only in degree. Work that moves from the agent to a reviewer does not disappear, it changes form. In screening mammography, Ahsen and colleagues model exactly this shape, comparing human-only, AI-only and delegation strategies in which a false positive and a false negative carry very different costs [1]. Their findings are specific to that setting and that cost structure and should not be lifted out of it, but the structure of the comparison transfers: when the two error classes are not symmetric, the allocation of work between the two parties is itself a decision rather than a detail.
The collaboration evidence is harder to read and worth reading anyway. Agarwal, Moehring, Rajpurkar and Salz report a controlled experiment in radiology in which giving readers AI assistance did not automatically improve their outcomes, and in which the contextual information available to the reader mattered to how the collaboration performed [2]. Their later work frames delegation as a sufficient-statistic problem, where the decision to escalate turns on a confidence signal rather than on uniform review [3]. Huang, Xiao and Vishnoi formalise the other half, showing that the reliability of verification is what determines whether delegation is worth doing in the first place [4].
The expected-cost equation
Once the configurations are named, one expression compares them:
TC = F + N · (X + V + p · L)
Six terms. F is the annualised fixed cost: implementation, licensing, training, policy administration. N is the annual volume of completed cases or transactions, defined once and held the same on both sides. X is the execution cost per transaction. V is the verification and review cost per transaction, which is zero in the AI-only configuration and is not zero in the reviewed one. p is the probability of an error per transaction, measured after the controls that configuration actually has. L is the financial consequence of one error, including remediation and everything downstream of it.
Written this way, the comparison stops being an argument about error rates and becomes an argument about six numbers, each of which an organisation can go and measure. The term that most often decides the outcome is F, because it is the only one that does not scale with volume.
This is standard expected-loss arithmetic. It is not a new result and it is not offered as one. What follows is a way of applying it where the inputs are contested, and of showing which inputs would have to be true for the answer to change.
The break-even question falls out of the same expression. For a fixed volume and a positive error cost, the largest agent error rate that still beats the human process is:
p* = [F_H − F_A + N · (X_H + V_H + p_H · L_H − X_A − V_A)] / (N · L_A)
A negative threshold means the agent cannot win even at a zero error rate, which usually says the gap is structural rather than a matter of model quality. A threshold above one means the agent wins across the whole range of mathematically possible error rates in this simplified model. Neither result is a number to clamp quietly; both are answers.
Running the numbers
The calculator runs this arithmetic in the browser. Nothing is sent anywhere: the assumptions live in the page, the exports are files you keep, and a shareable link is opt-in rather than automatic.
ToolThe Cost of Being WrongWhen does an imperfect AI agent become economically preferable to a human process?Open the toolA worked example, taken from the acceptance cases in the model specification and labelled illustrative because it is not a measurement: 100,000 transactions a year; a human execution cost of 10 each, a two percent error rate and a loss of 100 per error; an agent execution and verification cost of 0.50 each, a ten percent error rate and the same loss of 100; and no fixed cost on either side. The human process costs 1,200,000 a year. The agent process costs 1,100,000. The agent carries five times the error rate and is cheaper overall, and the break-even error rate is 11 percent.
Add a fixed cost of 150,000 to the agent side and the agent total moves to 1,250,000 and the break-even rate falls to 9.5 percent. Those figures describe a configuration, not an organisation. They are useful because every term is visible, and every term is replaceable with something measured.
Error taxonomy: detected and undetected
Errors are not one thing, and a rate that mixes them hides the only number that matters.
An error caught before it reaches anyone costs what putting it right costs: rework, a correction, a second opinion. An error that gets through costs whatever it costs downstream, and downstream costs are open-ended. If the probability of an error is p, the probability that it is detected given that it happened is q, the correction cost is R, and the undetected loss is L, then the expected loss per transaction is:
p · [q · R + (1 − q) · L]
Two things follow. First, the loss per error is not L. It sits between R and L, and how close to L it sits depends entirely on detection. Second, detection is neither free nor perfect, so q is an input to argue about rather than a constant to assume.
One condition hides inside q, and it decides whether any of this holds. Review only counts if it can catch something. A reviewer handed plausible output and asked to sign off will often sign off, and a review step measured that way reports a detection rate that no longer describes the world. The rate has to be measured against a known answer, blind, on the cases that are hardest rather than the ones that are easiest.
The practical consequence is that reviewing every output is not the conservative choice. Review raises q and it raises V at the same time. Whether that trade is favourable depends on the values, which is the calculation above and not a matter of principle.
Uncertainty, severity and the tail
An error rate is an estimate before it is a number, and the estimate is only as good as the sample behind it. Thirty cases is not a precise six percent, any more than a handful of flips is a fair coin. It is not wrong. It is also not a rate anyone can plan against.
Two corrections follow from that. Any stated rate should carry its sample size and a confidence interval beside it, and the honest response to a wide interval is to say so rather than to pick the convenient end. The calculator computes an interval for each sample and reruns the whole calculation at the upper and lower bounds, which is usually more informative than the point estimate.
Severity matters as much as frequency, and an average hides it. A process with a thousand two-dollar errors and one hundred thousand dollar error has an average loss of two dollars and an entirely different risk profile from one with a thousand two-thousand-dollar errors. Severe events belong on their own line, with their own probability and their own loss, rather than inside an average.
Then there is correlation. The arithmetic above assumes errors are independent, and in deployment they are not. One bad prompt, one bad model version or one bad integration can affect every case in a run. The damage is not p times average loss; it is a fraction of the entire volume. That is a different calculation, and it belongs in the model as a stress scenario with a stated blast radius, reported beside the expected value rather than folded into it.
When review helps, and when it does not
Review is not free, and it is not always worth its cost. In one customer-support setting, Brynjolfsson, Li and Raymond observed measurable productivity gains among working agents using generative AI assistance [5]. That is a real finding, observed in a real setting, with the review and quality processes that setting already had. It is not a general estimate of what happens when an agent meets an unfamiliar process, and it is not used as one here.
A result from one setting describes what happened there. It does not travel to a process with a different mix of cases, a different error taxonomy or a different review policy, and the parts that port most easily are rarely the parts that decide the question.
The question is not whether review is good. It is whether what review catches is worth what review costs, and that comparison needs the same arithmetic as everything else. Review at one hundred percent is rarely the answer. Review triggered by a confidence signal, sampled for audit and applied to a risk-ranked queue is usually closer.
Deployment boundaries
- Legal and regulatory duties, including the rules of whatever profession the process sits inside.
- Privacy obligations, which frequently settle the question before economics reaches it.
- Safety, where the harm from an undetected error is not measured in dollars.
- Contractual commitments to customers, counterparties or a regulator.
- The organisation's own policies, which bind whether or not they happen to be law.
A lower expected cost is not permission to cross any of these lines. The calculator therefore carries them as hard stops: tick one and the answer becomes not permitted, whatever the savings say on the same screen.
Limitations
- The model assumes a stable process. It does not describe drift, retraining, or what being wrong costs in the second year.
- The independence assumption behind the error term is optimistic in practice, which is why the stress scenarios exist at all.
- Loss estimates are the least reliable inputs in the model and the ones most often supplied from memory.
- The worked figures are illustrative. They are not measured results and they do not come from a client engagement.
- The underlying arithmetic is standard expected-loss economics. What is offered here is an accessible implementation, explicit assumptions and a decision workflow, not a new result.
The citations are being validated against the publisher pages. Where a source is a working paper or a discussion paper it is labelled as one here and in the bibliography, and no finding from one setting is presented here as a general law.
Sources
- Economics of AI and human task sharing for decision making in screening mammographyMehmet Eren Ahsen; Mehmet U. S. Ayvaci; Radha Mookerjee; Gustavo Stolovitzky. (2025, peer-reviewed). Retrieved 2026-10-21.
- Combining Human Expertise with Artificial Intelligence: Experimental Evidence from RadiologyNikhil Agarwal; Alex Moehring; Pranav Rajpurkar; Tobias Salz. (2023; revised 2026, working paper). Retrieved 2026-10-21.
- Designing Human-AI Collaboration: A Sufficient-Statistic ApproachNikhil Agarwal; Alex Moehring; Alexander Wolitzky. (2025; revised 2026, working paper). Retrieved 2026-10-21.
- Delegation and Verification Under AILingxiao Huang; Wenyang Xiao; Nisheeth K. Vishnoi. (2026, discussion paper). Retrieved 2026-10-21.
- Generative AI at WorkErik Brynjolfsson; Danielle Li; Lindsey R. Raymond. (2025, peer-reviewed). Retrieved 2026-10-21.
Related reading
 Article · November 11, 2026
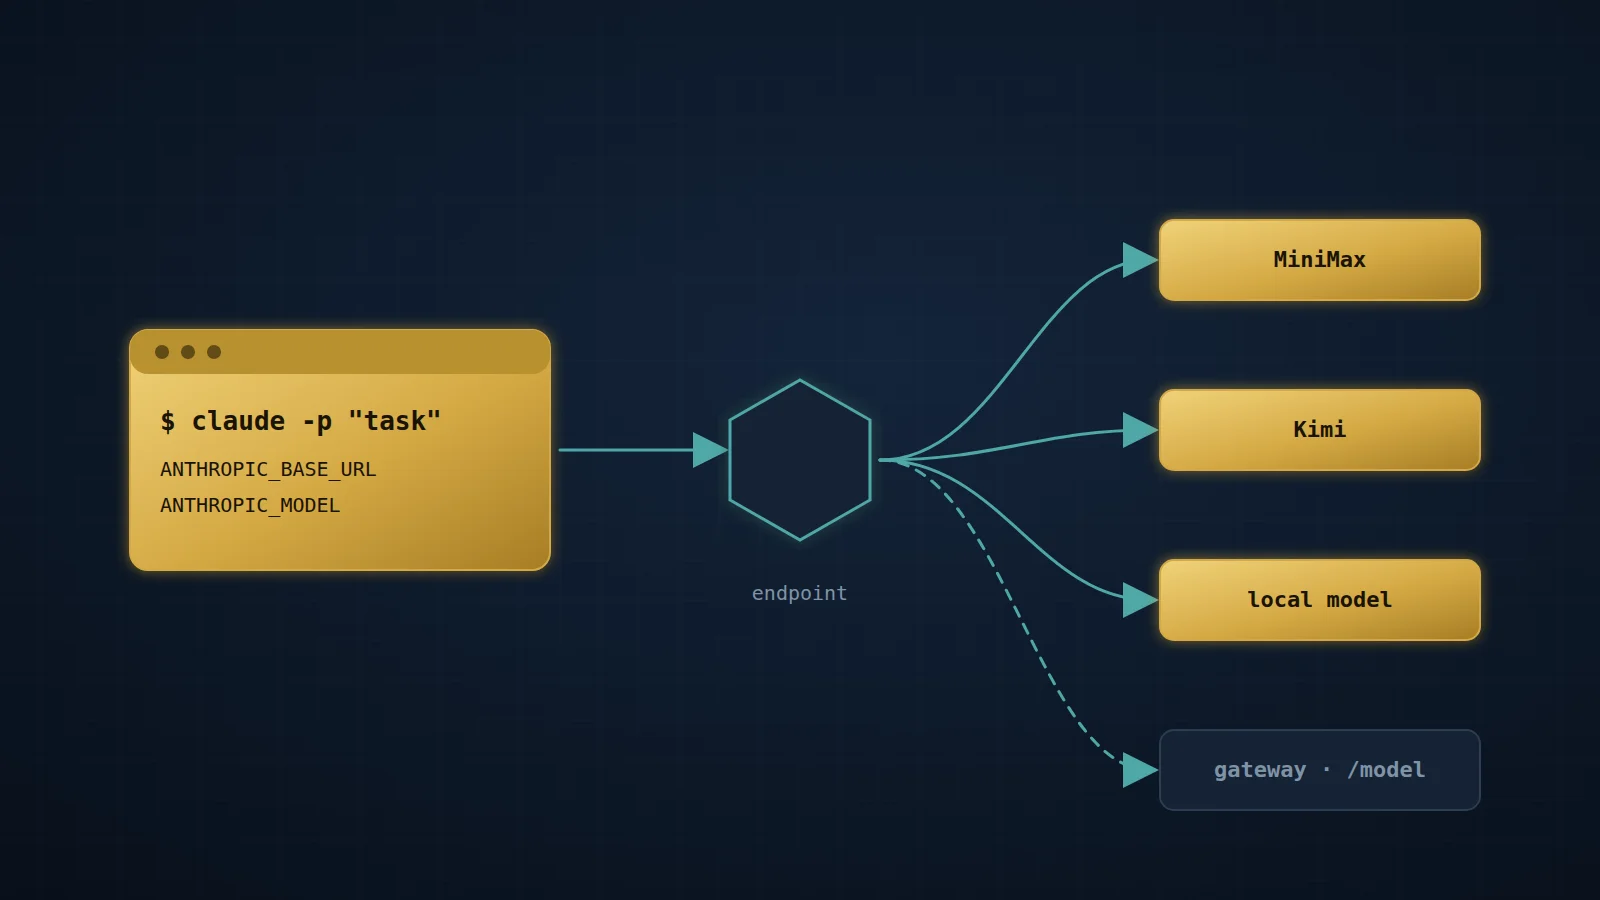
Claude Code, headless, on other models
Three environment variables point a headless Claude Code session at MiniMax, Kimi or a local model. The wrapper scripts that make it run unattended, the six failures they fix, and why the planner reruns the checks.
 Article · November 7, 2026
Four tools, any model: letting chat make pictures and video on a home GPU
A recipe for letting any chat model in Open WebUI make pictures and short videos on a local GPU workstation: four thin tools in front of one image and video API, one model preset per chat model, and a phone as the front end.
 Article · October 28, 2026
One agent loop or many: a personal multi-model rig measured against Anthropic's advice to fold subagents
Anthropic now advises collapsing specialist subagents into one agent loop that loads skills on demand. My rig hands bounded work from one Claude Opus parent to cheaper models from four vendors. This piece sets Anthropic's advice beside vendor guidance, published measurements and my own logs, then lists six changes to the rig.